Everything you need to know about Squarespace Analytics

It's no secret that I love building website on Squarespace for many reasons but one of the points that I keep coming back to is just how intuitively the features are laid out. Most people who opt for a Squarespace website are looking for a one-and-done platform and in this area, Squarespace delivers. There's no fiddling with extra plugins or add-on features, adding additional code is entirely optional, and almost anything you want to do can be achieved within a few simple clicks through the Squarespace backend.
Analytics are one of the most fun features to play around in with Squarespace, especially for a data nerd like myself! The sky is the limit when it comes to reviewing your website's trends, visitor behaviour and to see what's working and what isn't in your business. Not only does Squarespace provide a veritable goldmine of information, the layout is simple to use and navigate, which are all wins in my book.
Today I'm going to walk you through the Squarespace Analytics features and give you an overview of how it's all organized on the backend. As you get more familiar with the analytics, you'll have a better understanding of who your audience is, where they're coming from, what they're viewing on your site and what they're most interested in.
Related : How to use Squarespace Analytics to better understand your website's audience
Note: we are focusing on Squarespace Website plans here, not Cover Pages (RIP) or Online Stores.
Accessing the Analytics Platform
To access the Squarespace Analytics platform, simply log into your Squarespace account and select Analytics from the Menu List (left side of the page).

Here is what the Analytics Platform looks like:

As you can see, there's a wealth of information available through the Analytics platform but if you don't understand what all the terms mean, it can be overwhelming!
Fear not, my friends, I'm here to walk you through each section in the Squarespace Analytics platform and explain what's available and what value it provides. Let's get started!
Note: all screenshots are from one of my other tester websites, not charlotteohara.ca!
Traffic Overview
Traffic Overview is a "bird's eye view" or high level look at the traffic your website receives. It's where you can see website traffic, page views, audience size, unique visitor numbers, etc.
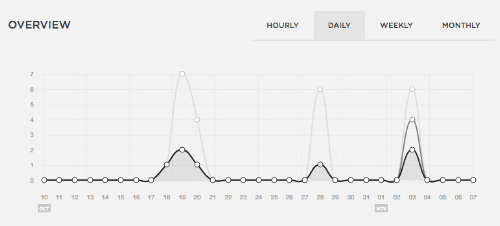
One of my favourite things to filter through is the timeframes: you can select between Hourly, Daily, Weekly or Monthly views.
The screenshot to the right (reminder: from one of my tester websites, not this one!) shows the Traffic Overview in the Daily timeframe. This graph shows changes to Visits, Page Views, and Audience Size over time, represented by three lines. If you hover over any of the dots on the graph, you'll be able to see that specific time's data.
Note: you'll need to scroll down the the Traffic Overview page to see more of the data below the graph and table.
Below the graph is a table that shows the data in the timeframe you selected. In this case, I had selected the Daily view so each row has it's own day. For each day, you can see columns for Visits, Page Views and Audience size and the bar graph represents growth in these areas (see Nov 3rd or Oct 28 in the example below).


The final sections on the Traffic Overview page are the Browser and Operating System sections. The Browser section breaks down the percentage coming from each browser, while the Operating Systems look at the percentage of operating system used to visit your site, including Mobile browsers.
We mentioned above that the table and graph look at three sections: Visits, Page Views, and Audience Size so let's explore those.
Visits
A visit is a single browsing session by the same visitor. A visitor can check out multiple pages of your website during the same visit. Visits are a good way to see how many eyes are on your site during a specific timeframe. Visits are tracked with a browser cookie that expires after 30 minutes, but Squarespace counts that same visitor as having different visits if they come back to your site multiple times a day outside of that 30 minute window.
Page Views
A page view is a look at every page hit on your site that loads completely.
Audience Size
Audience Size (previously known as Unique Visitors) is an estimate of total number of visitors who reached your site during the set timeframe. This is tracked via a browser cookie however if the visitor cleans their cookies or visits your site from another browser (i.e., normally they view from Chrome but this time it was from Safari), Analytics counts this as a new visit from a visitor. Audience size is a good way to see if visitors are loyal to your site.
Mobile Usage
Mobile Usage shows you a breakdown of site visits from mobile devices. The time chart and table can be changed to view data Daily, Weekly or Monthly. It shows you what percentage of visits come from a mobile browser versus a desktop browser.
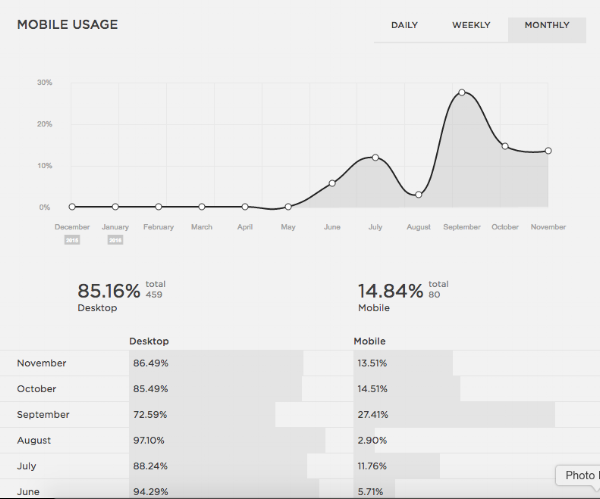
Below that is a further breakdown of Desktop Operating Systems (OS) and Mobile Operating Systems (OS).

Note: Be sure to read this article to see why this information is important to better understand your website's audience
RSS Subscribers
RSS Subscribers estimates the total amount of traffic that your RSS feed(s) receives in a selected time frame (Daily, Weekly or Monthly).
This section shows an rough number of the unique subscribers you have for each RSS feed (e.g., Blog pages or other collections). It should be noted that the RSS count is an estimate and may contain inaccuracies since the RSS feed readers use varying forms of technology to view your content.

Referrers

Referrers outlines the external sites that sent traffic to your site, or other sites from which visitors arrived at yours. The pie chart shows a breakdown of all the referral sites and you can select your desired timeframe (1 Day, 2 Days, 3 Days, Week or Month). This is great because you can identify where most of your traffic is coming from, or if there has been a sudden spike in traffic thanks to a particular referrer (e.g., a media mention, featured article on your business, guest post, etc.)
The table ranks the referrers by page views. Count is the number of page views from that referrer. The dots on each row (right hand side) indicate that there are multiple URLs from that source and you by clicking those dots, you can see an expanded URL view.
Popular Content
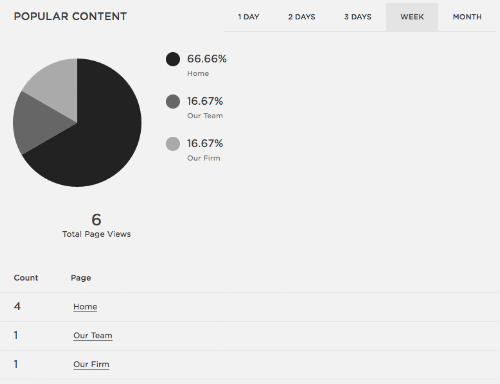
Popular Content breaks down the most popular content on your website by the percentage of page views each receives. All URLs/pages on your site are included in this section. This breakdown is shown on the pie chart and then the percentage breakdown is further explained on the right.
The table below the pie chart ranks the popular content on your website from highest number of pages views to lowest. By keeping an eye on your popular content, you can see what your audience is interested, if any pages or blog posts have "gone viral", etc.
Search Engine Queries
Search Engine Queries displays the search terms user typed into a search engine (like Google) to find their way to your website. These terms are plotted in a pie chart, ranking from most to least popular in percentages. Not all keyword searches are reported by Squarespace since Google protects users search terms for privacy reasons - more about that here. Results can be filtered by 1 Day, 2 Days, 3 Days, Week, or Month.
Site Search Queries
Site Search Queries reports on how visitors search internally on your site using the various search boxes across your site (if you have opted to use them). Like most Squarespace Analytics tabs, Site Search Queries offers several timeline filters such as 1 Day, 2 Days, 3 Days, Week, and Month. Note: If this panel shows a “No Data Available” message for all time filters, you either don’t have a search feature on your site or visitors didn’t search your site in the selected time frame.
Activity Log
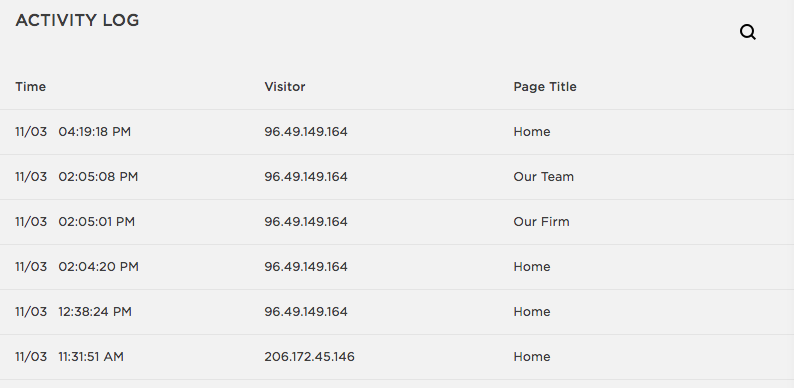
The Activity Log is a searchable list outlining all the times during the last 7 days that a visitor viewed a page on your website. This log includes information about the visitor's IP address, browser version, operating system, referrer, etc.
Et voila! Now that you have a deeper understanding of all the features available in Squarespace Analytics, you can browse through your website and visitor data much more effectively.
A Note on Squarespace Analytics and Google Analytics
While I absolutely love all the information available in Squarespace's native Analytics platform, I also use a combination of Squarespace Analytics and Google Analytics. By combining both analytics platform, I'm able to enjoy an extremely well rounded and detailed view of visitor activity to my website(s).
Related: Connecting your website to Google Search Console
Squarespace Analytics are perfect for daily insights but I favour Google Analytics for a more in-depth look at what's going on with my website. It's really easy to see trends, daily views, popular content, referrers and what brings people to your site and keeps them there through Squarespace's Analytics platform but there are limitations to how deep you can go. This is where Google Analytics is able to bridge the gap.
A quite note : you might notice a difference in reporting between Google Analytics and Squarespace Analytics and this is normal. Squarespace has an excellent article outlining the reasons for this, which you can check out here.
Final Thoughts
Squarespace Analytics might seem overwhelming at first glance but once you see how intuitively everything is laid out and just how powerful the data is, I have no doubt you'll be playing around with the platform in no time.
Don't forget that Squarespace has a great app that you can download and it includes all Analytics - it is perfect for checking your website stats on the go!
Using a combination of Squarespace Analytics and Google Analytics has given me a much stronger understanding of my business and what's working on my website and it can do the same for you. If you're interested in tracking website traffic, seeing where visitors are coming from and what they're interested in on your website, Squarespace Analytics is definitely worth your time!
Now it's your turn to tell me if you've ever used Squarespace's Analytics platform? Do you find it simple to navigate or are all the different sections confusing? Are you ready to dig deep into your website and visitor data to strengthen your business insights? Leave me a note in the comments, I'd love to know!
LAUNCH YOUR BEST SITE - FREE ECOURSE
Interested in learning more about what it takes to get a website up and running? Sign up for my free 7 day e-course!